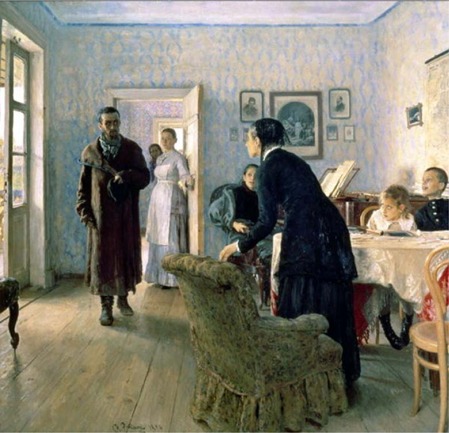
The Unexpected Visitor.
Oil on canvas painting by Ilya Repin, 1884–88.
(Source: Courtesy of www.ilyarepin.org.)
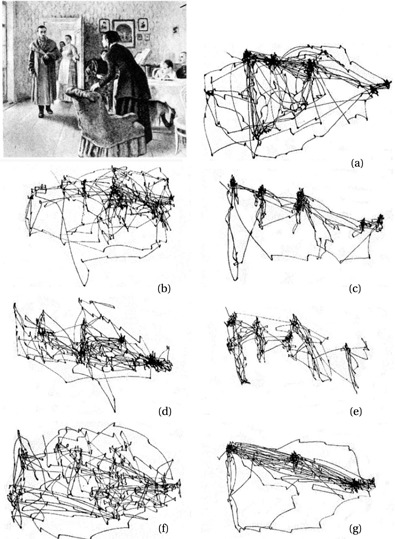
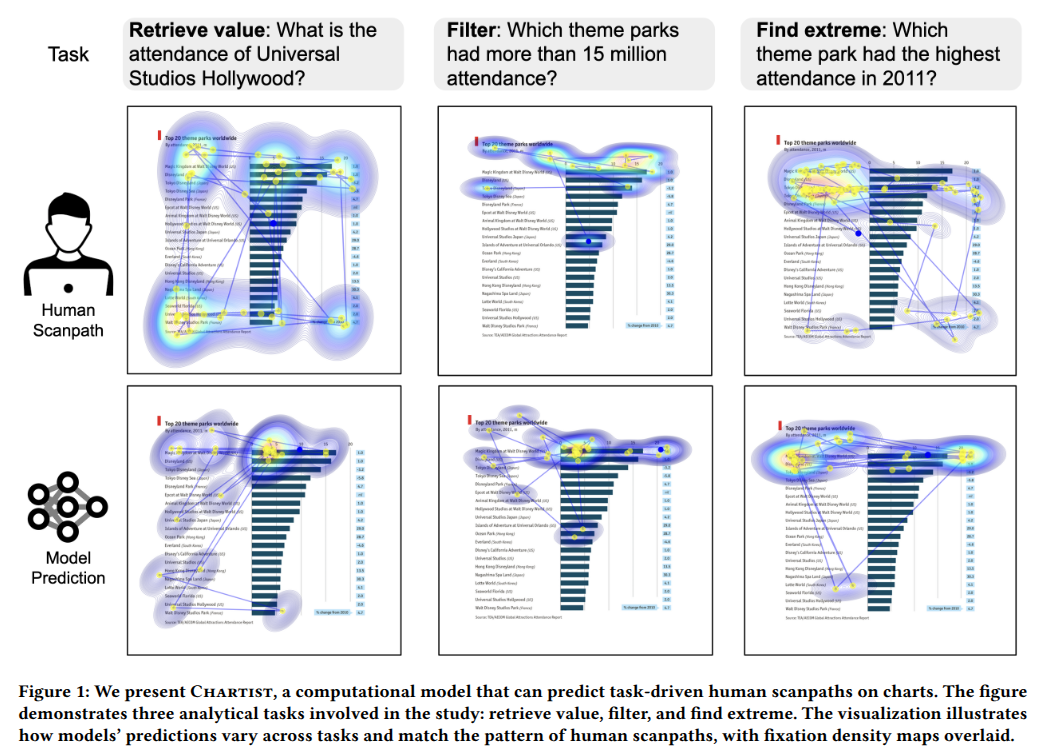
Tasks
- Free examination
- Estimate the material circumstances of the family
- Give the ages of the people
- Surmise what the family had been doing before the arrival of the ‘unexpected visitor’
- Remember the clothes worn by the people
- Remember the position of the people and objects in the room
- Estimate how long the unexpected visitor had been away from the family
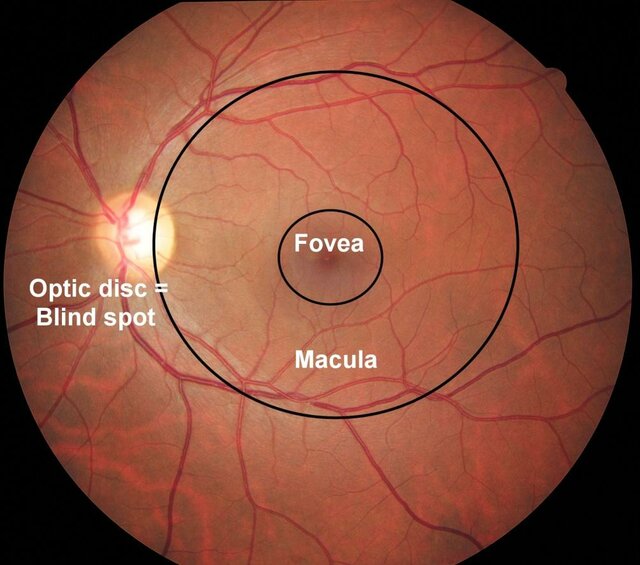
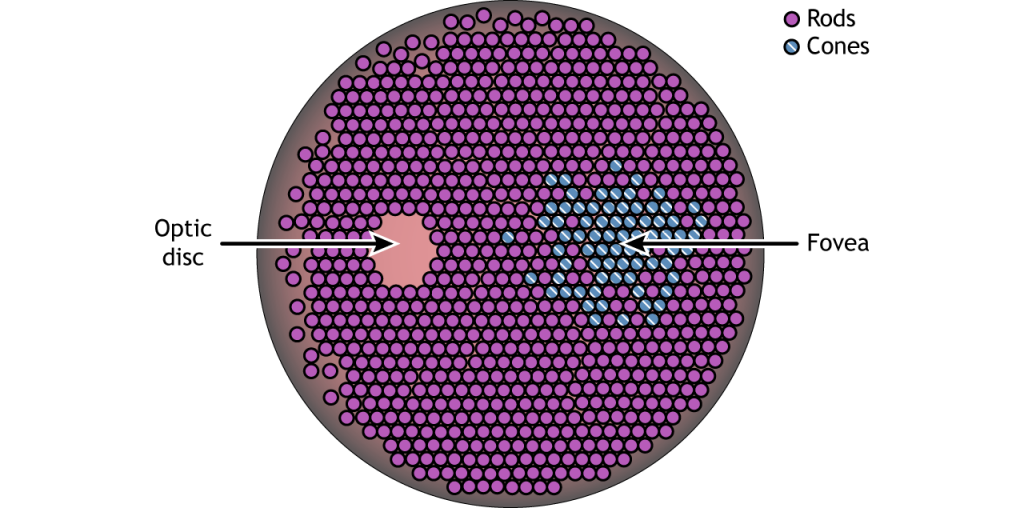
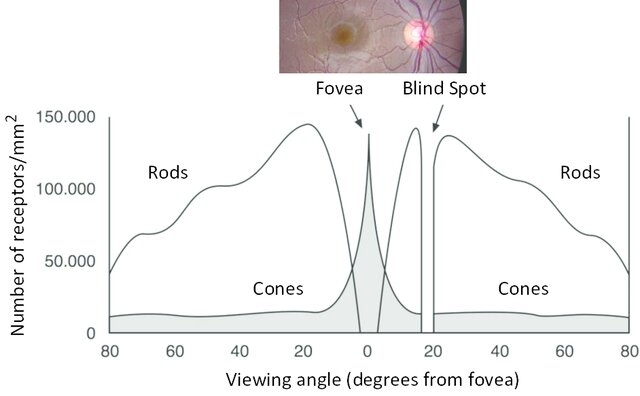
Neural recycling

1

2

3

4

5

6

7

8

9

10

Solutions
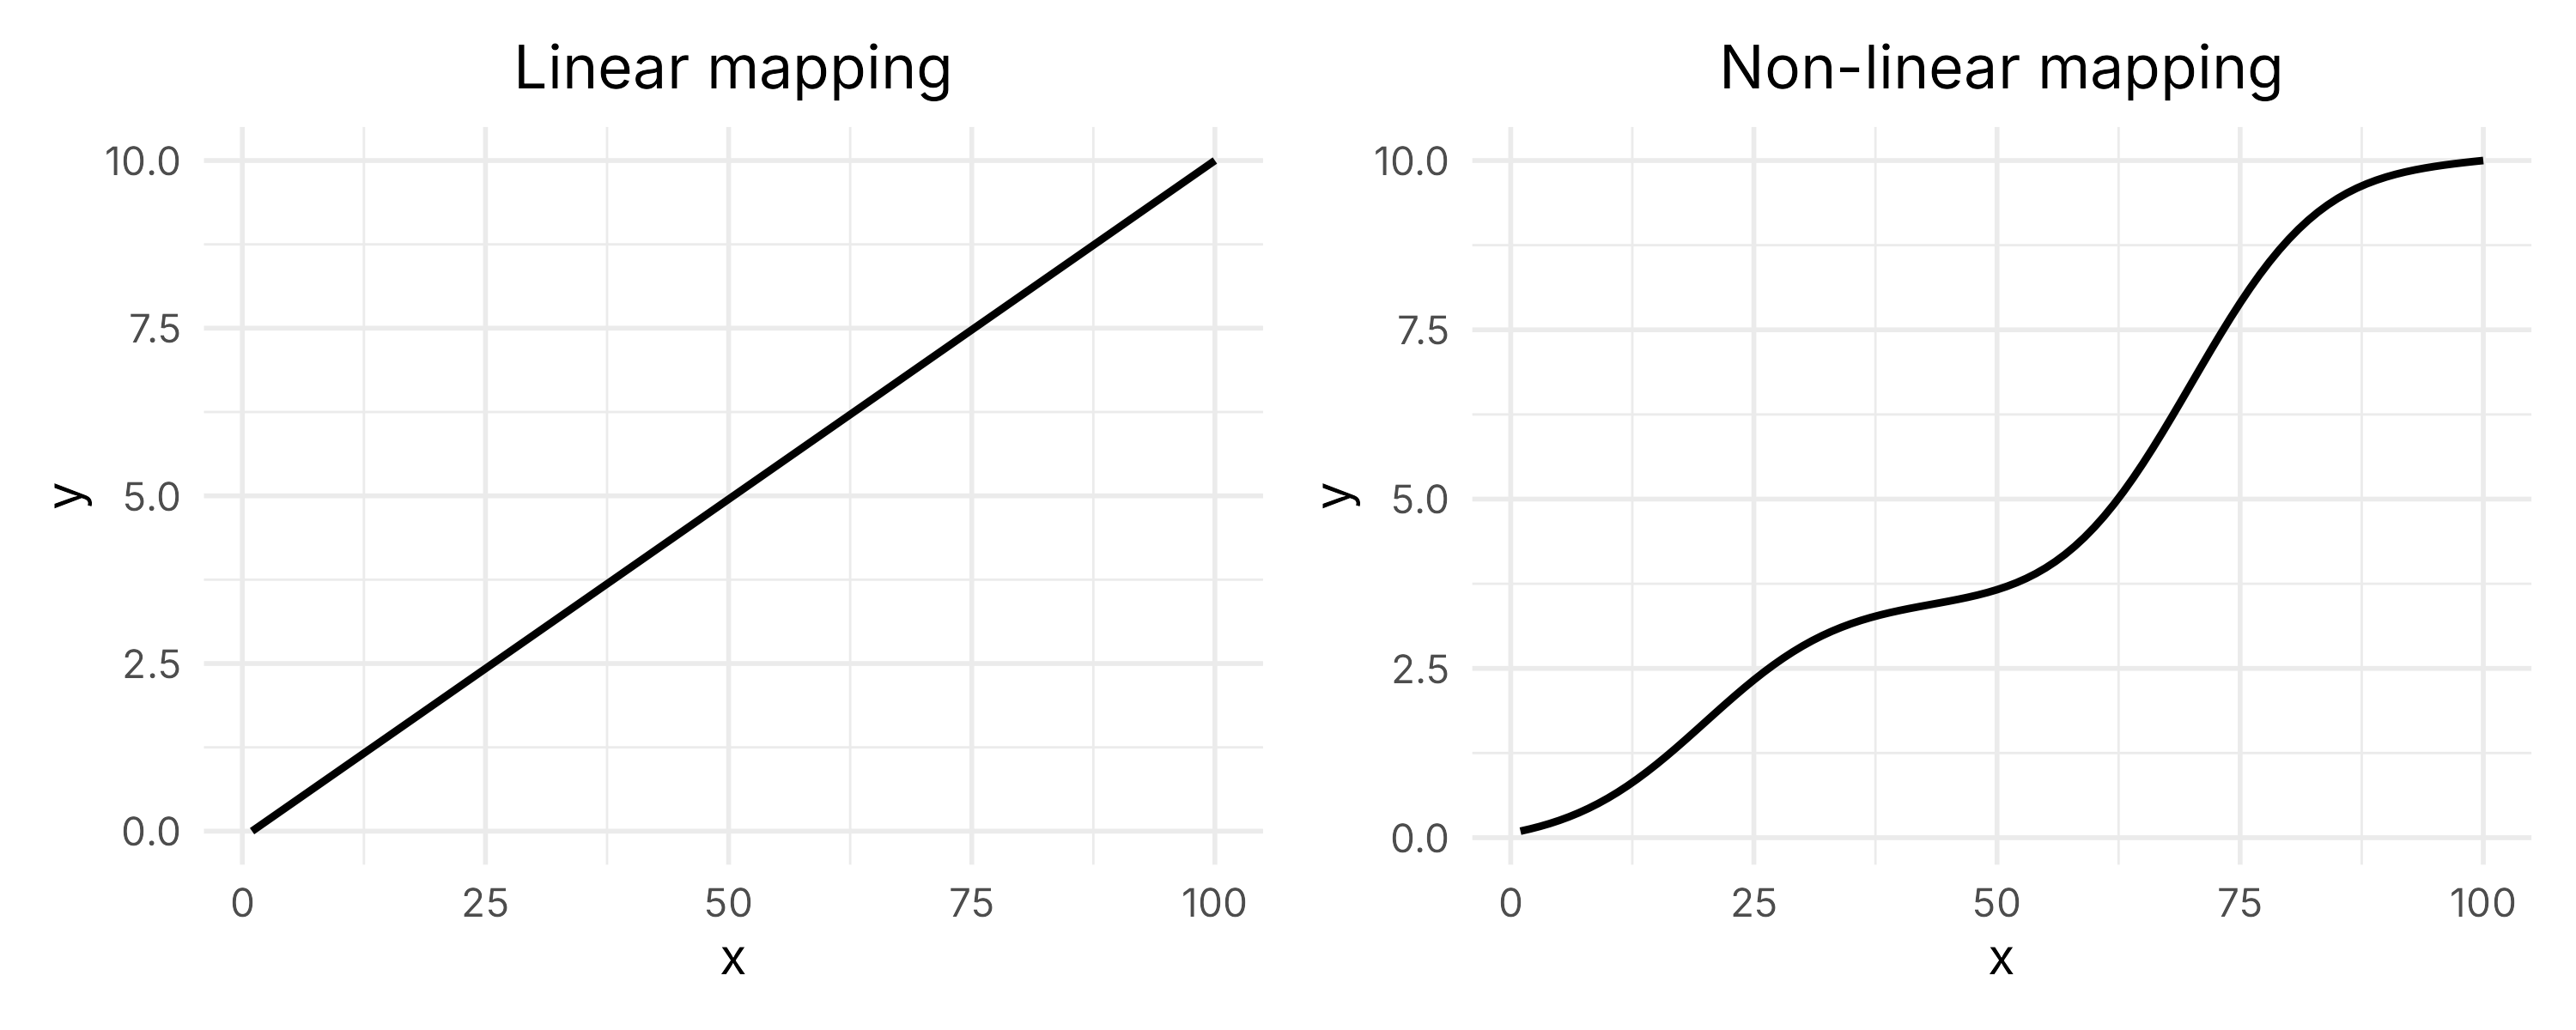
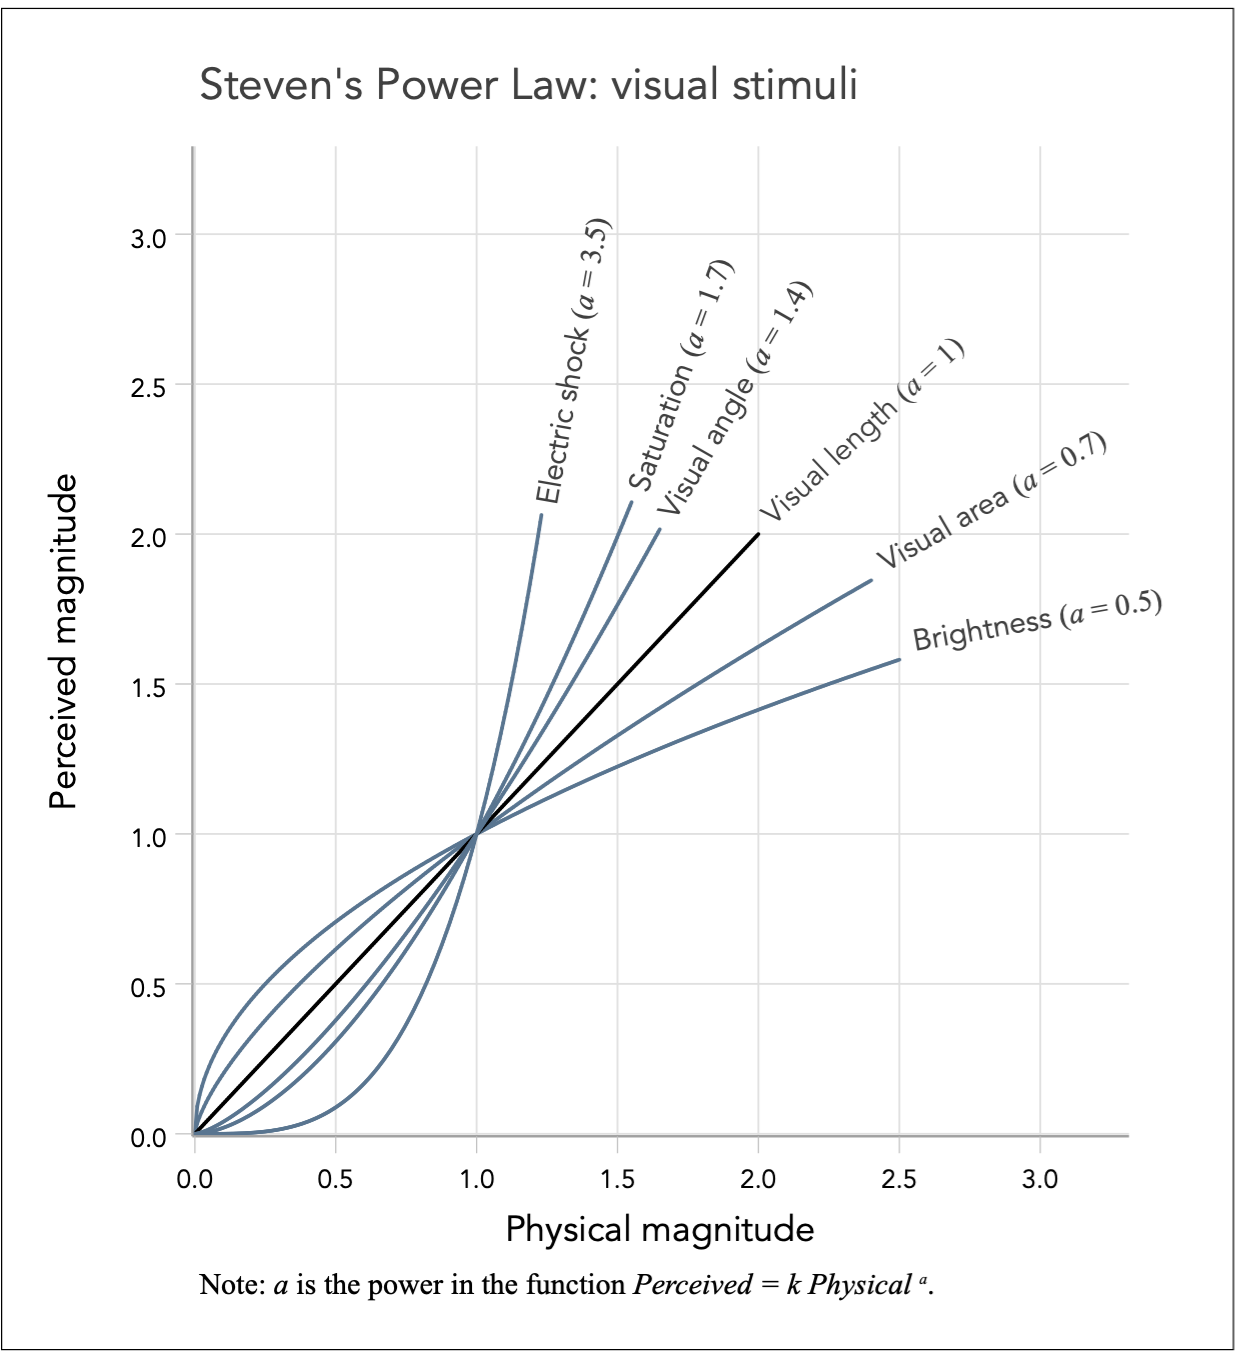
Stevens’ Power law

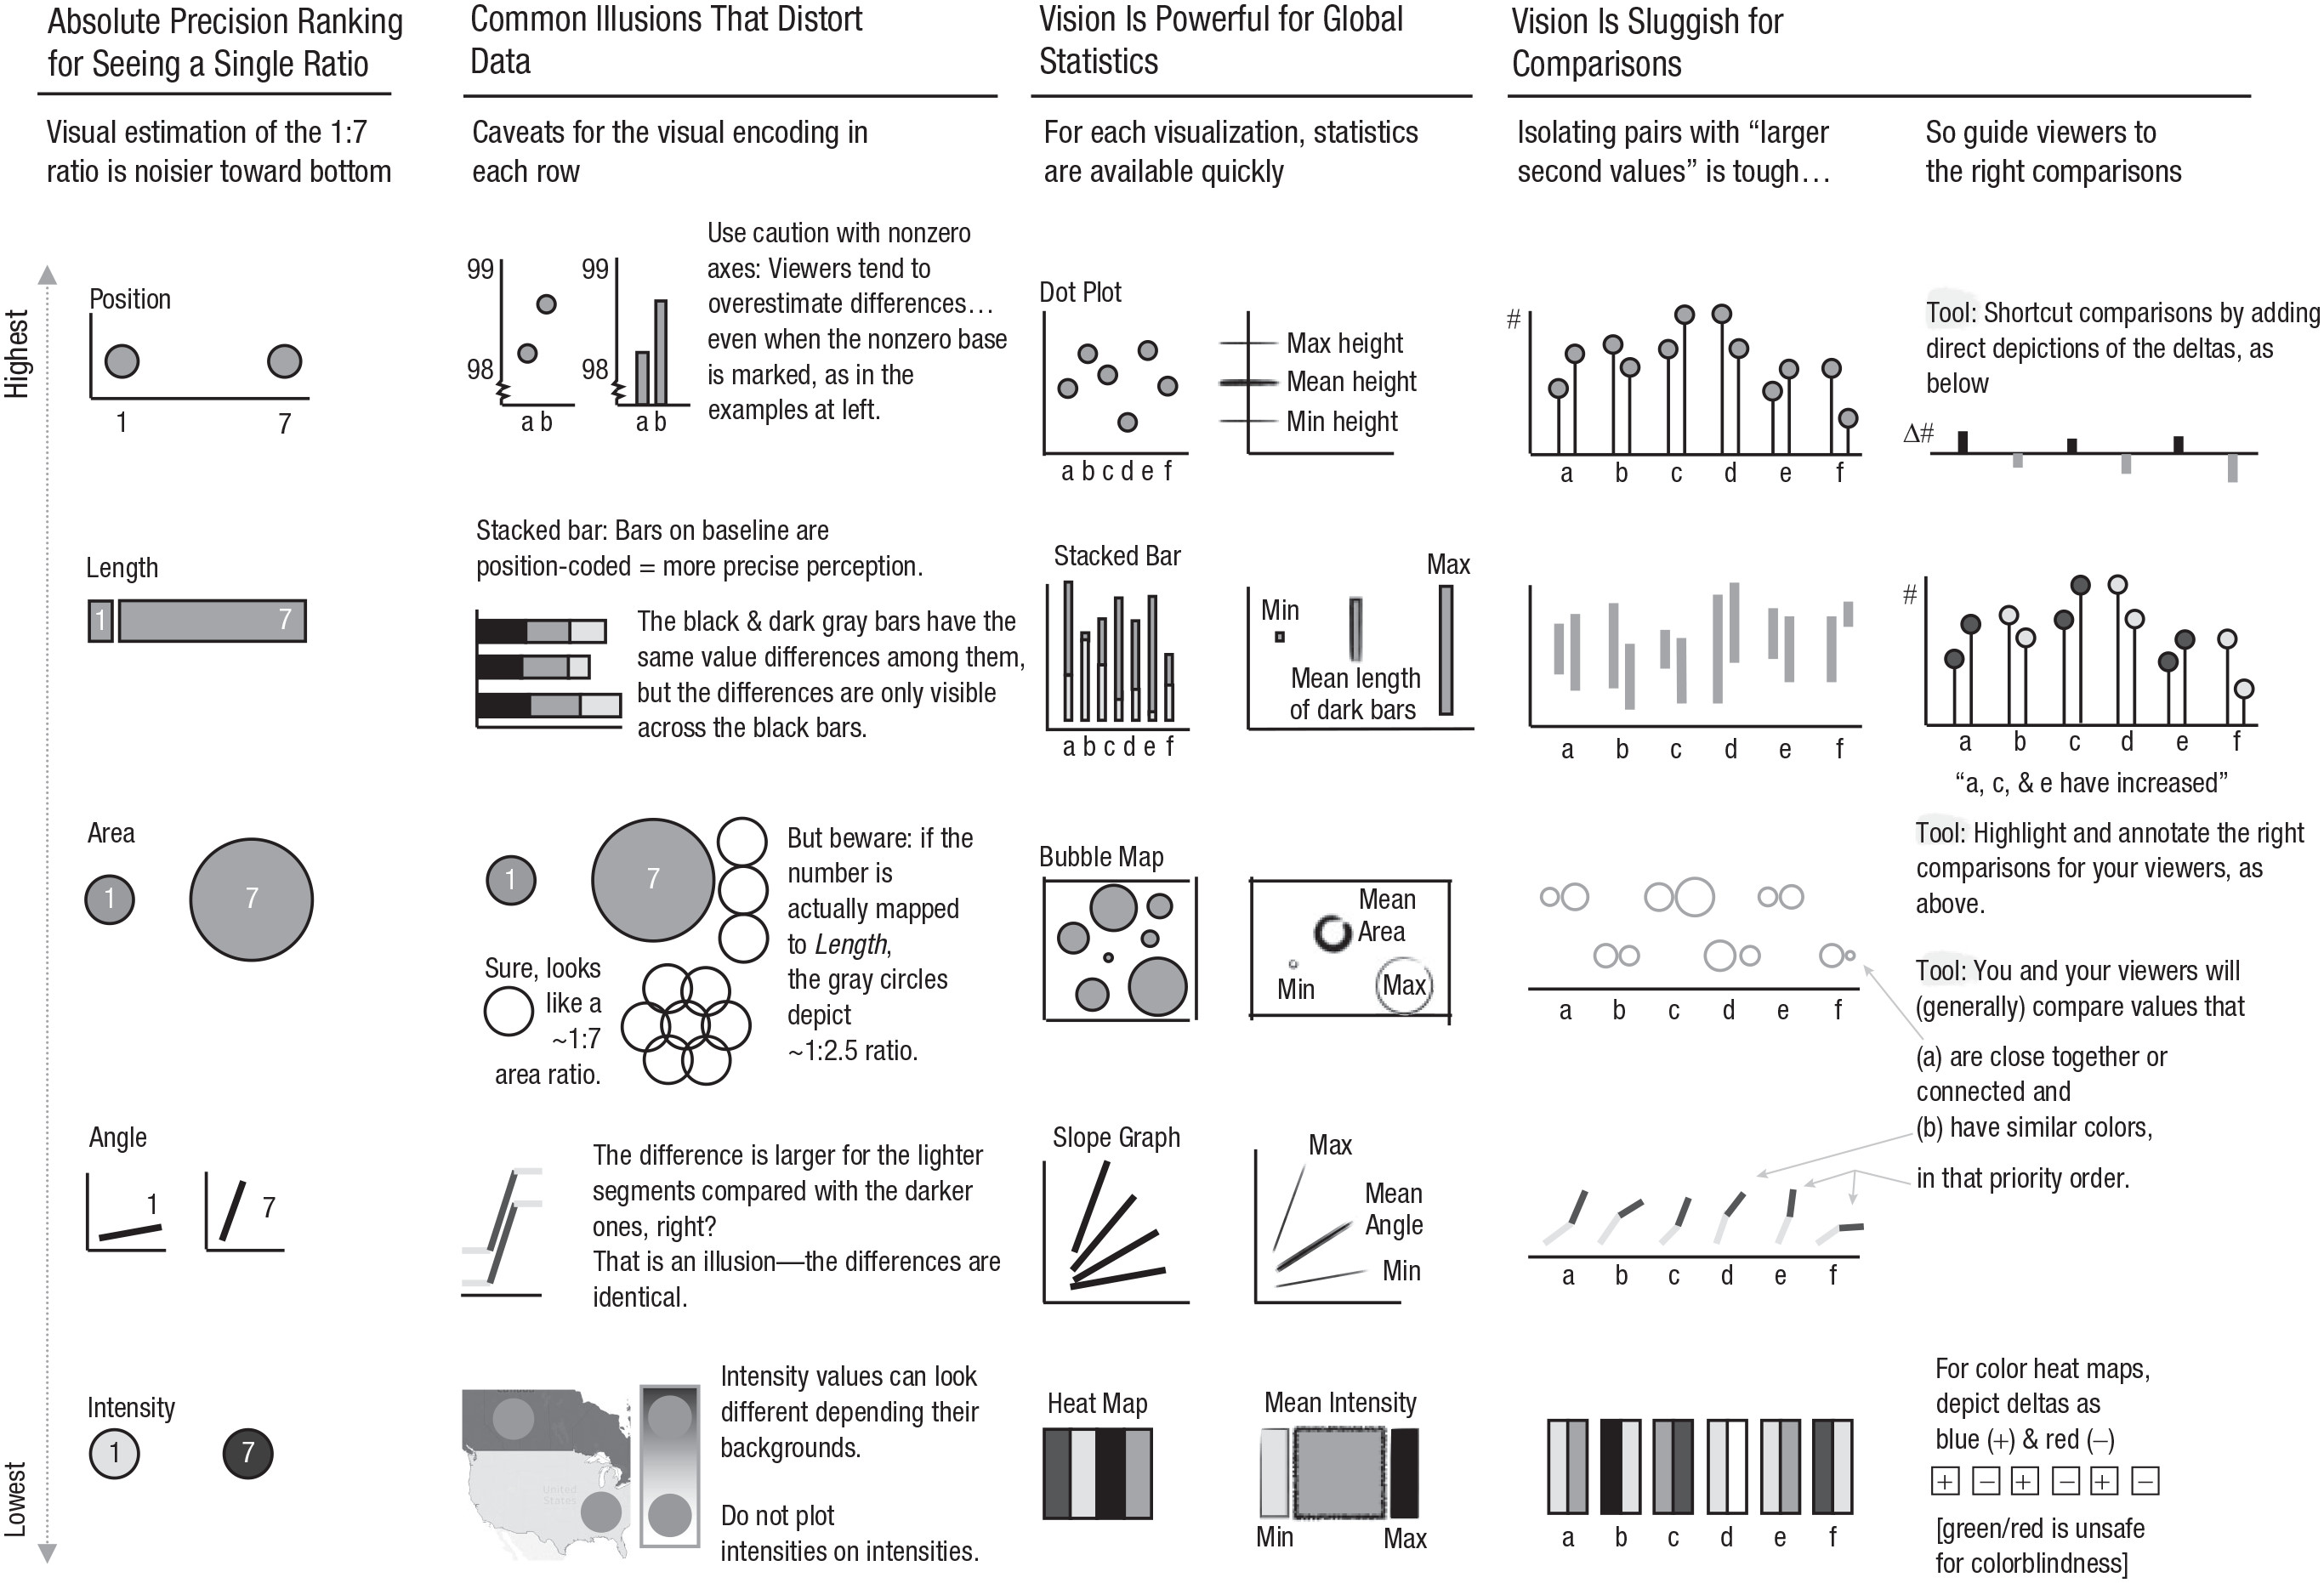
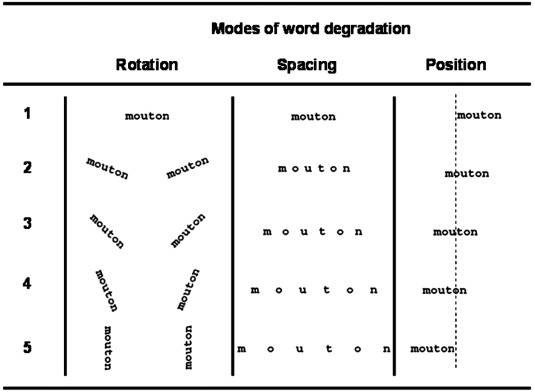
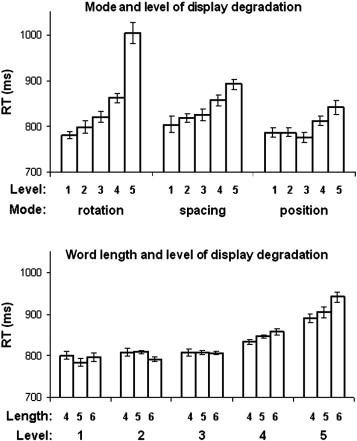
Text perception